Cell News 01/2017
23
WERNER RISAU PRIZE 2017
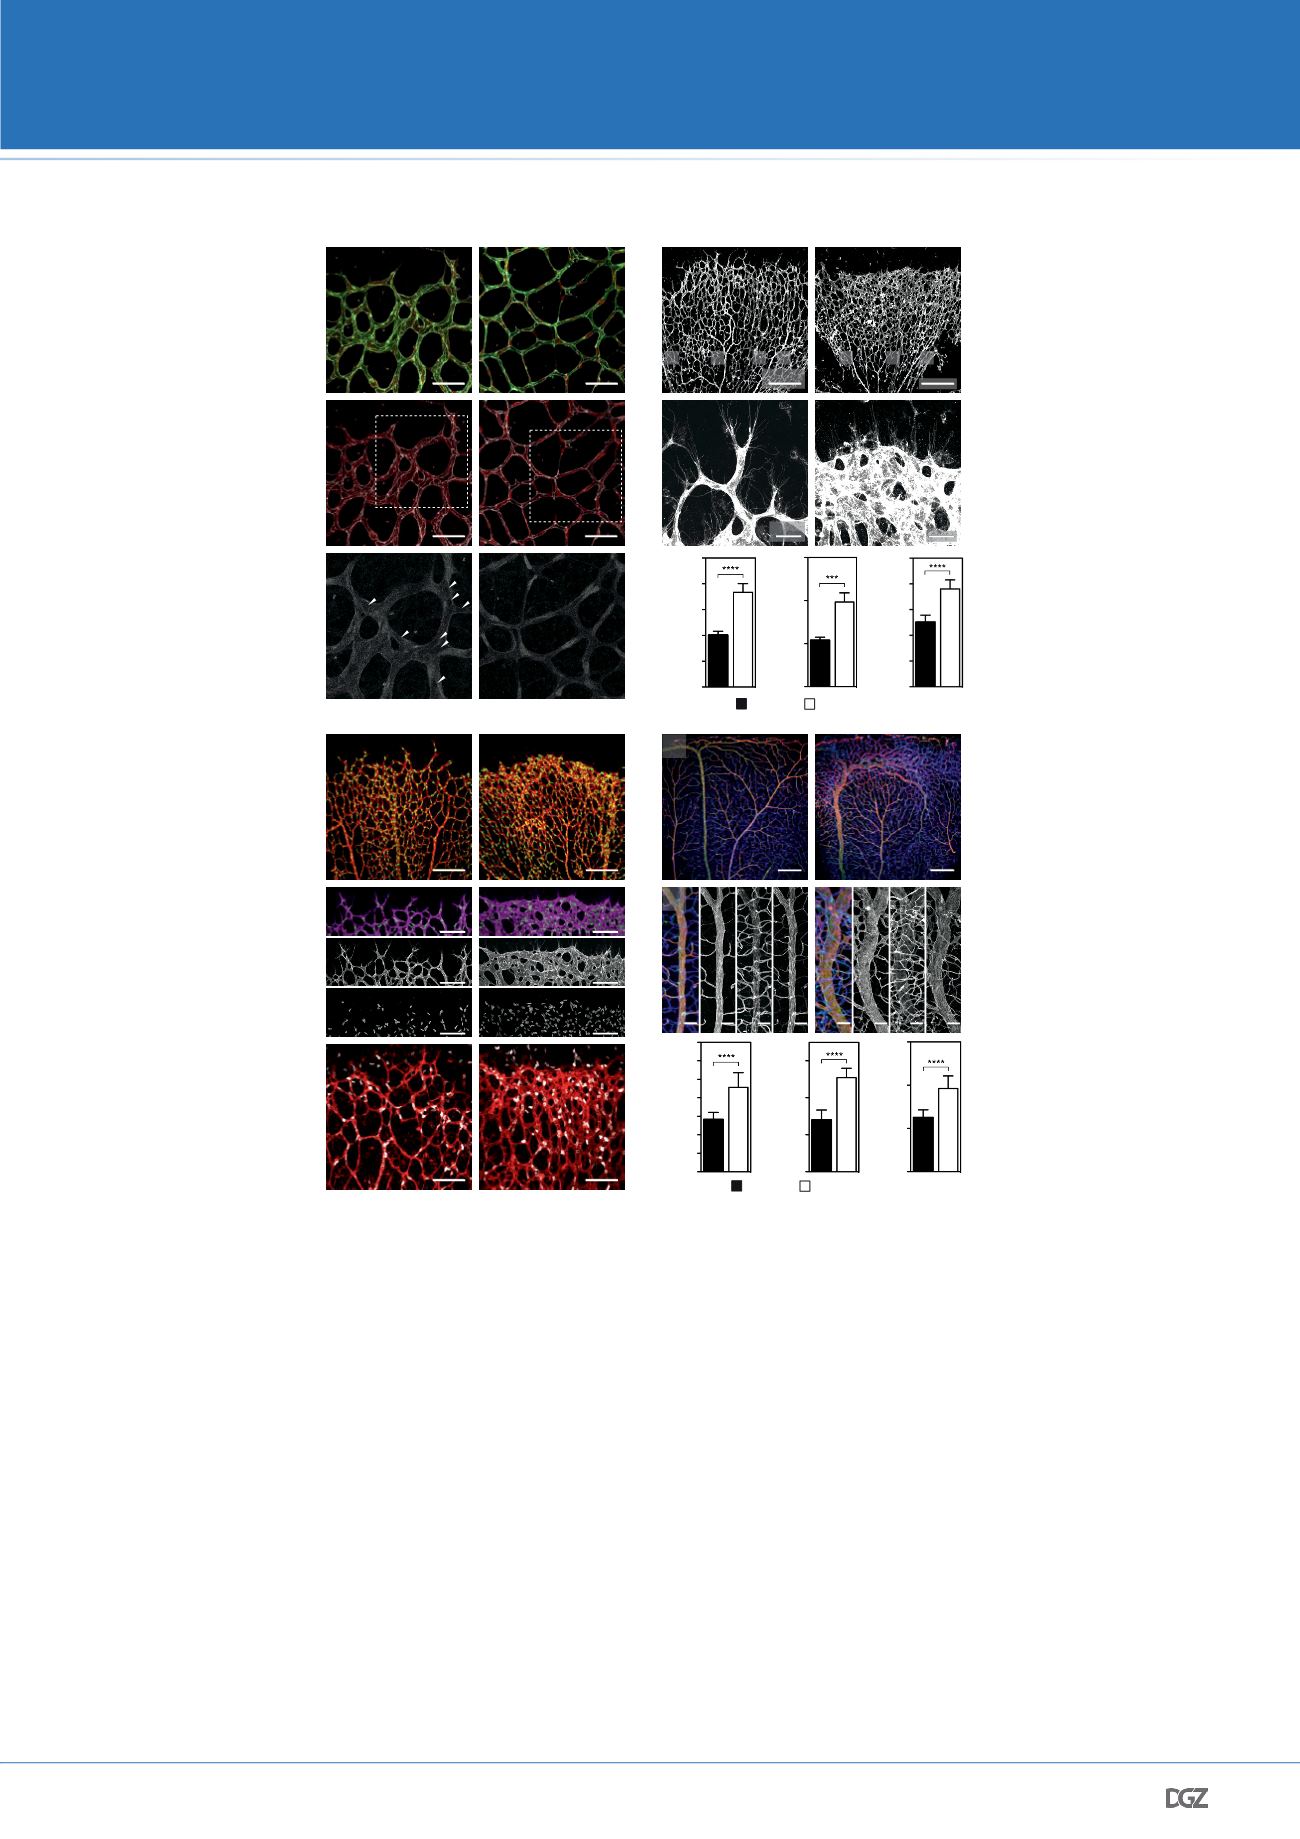
a, Immunofluorescence staining for FOXO1 (red), VE-cadherin
(VECAD; grey) and isolectin-B4 (IB4; green) in a P5 mouse reti-
na. The lower panels depict the isolated FOXO1 signal (grey) of
the boxed area shown in the middle panel. Note the diffuse nu-
cleo-cytoplasmic localization of FOXO1 at the angiogenic front
(left), while a stronger nuclear pattern is observed in the central
remodelling plexus (right). Arrowheads point to ECs with weak
FOXO1 nuclear staining. b,c, Overview (b) and higher magnifica-
tion (c) confocal images of IB4-stained (grey) retinal vessels of
P5 pups in
Foxo1
iEC-KO
as compared to control (
Foxo1
flox/flox
) mice.
A, artery; V, vein. d, Bar graphs showing the mean endothelial
area (n
≥
7), branch diameter (n
≥
7), and number of filopodia
per vessel length (n
≥
5) in
Foxo1
iEC-KO
mutant as compared to
control (
Foxo1
flox/flox
) mice. Data represent mean ± s.d. Two-tailed
unpaired
t
-test. e, Confocal images of IB4 (red) and nuclear ERG
(green) stained P5 retinas of control and
Foxo1
iEC-KO
mutant ret-
inas showing the hyperplastic growth of
Foxo1
-deficient blood
vessels. f, Confocal images of PECAM (magenta) and ERG (green)
stained P5 retinas in control and
Foxo1
iEC-KO
mice illustrating the
clustering of ECs at the angiogenic front. g, BrdU (grey) and IB4
(red) labelling of whole-mount control and
Foxo1
iEC-KO
P5 retinas.
h,i, Overview (h) and higher magnification (i) confocal images
of ICAM2 (green), IB4 (blue) and collagen IV (COL; red) stained
retinas at P21 showing the venous enlargement in
Foxo1
iEC-KO
mice. A, artery; V, vein. j, Quantifications of ERG/IB4- (n
≥
9),
BrdU/IB4- (n
≥
5) and pHH3/IB4- (n
≥
7) positive cells showing
increased endothelial proliferation in the hyperplastic retinal
vasculature of
Foxo1
iEC-KO
mutant mice. Data represent mean
± s.d. Two-tailed unpaired
t
-test. Controls are Cre-negative
littermates.
***P <
0.001;
****P <
0.0001.
Figure 1
a
Angiogenic front
b
Remodelling plexus
EC area per field (%)
20
0
IB4
Foxo1
iEC-KO
Control
e
Foxo1
iEC-KO
Control
ERG
/
IB4
f
40
60
80
100
20
0
10
30
Vessel diameter (
μ
m)
ERG
+
-cells per field
0
40
80
120
Foxo1
iEC-KO
Control
140
100
60
20
FOXO1
/
VECAD
/
IB4
IB4
50
μ
m
FOXO1
/
VECAD
FOXO1
c
d
50
μ
m
20
0
10
30
Number of filopodia
BrdU
+
-ECs per field
0
40
60
20
200
μ
m
h
Foxo1
iEC-KO
Control
j
Foxo1
iEC-KO
Control
pHH3
+
-ECs per field
0
20
30
10
40
50
ERG
/
PECAM
100
μ
m
100
μ
m
100
μ
m
ERG
PECAM
Merge
BrdU
/
IB4
g
100
μ
m
ICAM2
/
IB4
/
COL
ICAM2
/
IB4
/
COL
i
50
μ
m
V
A
V
A
250
μ
m
V
A
A
V A
A
COL IB4 ICAM2
P21
P21
A V A
V
V A
A
25
μ
m
200
μ
m
Figure 1 – Endothelial FOXO1 is an essential regulator of vascular growth.


