Cell News 02/2017
24
WERNER RISAU PRIZE 2017
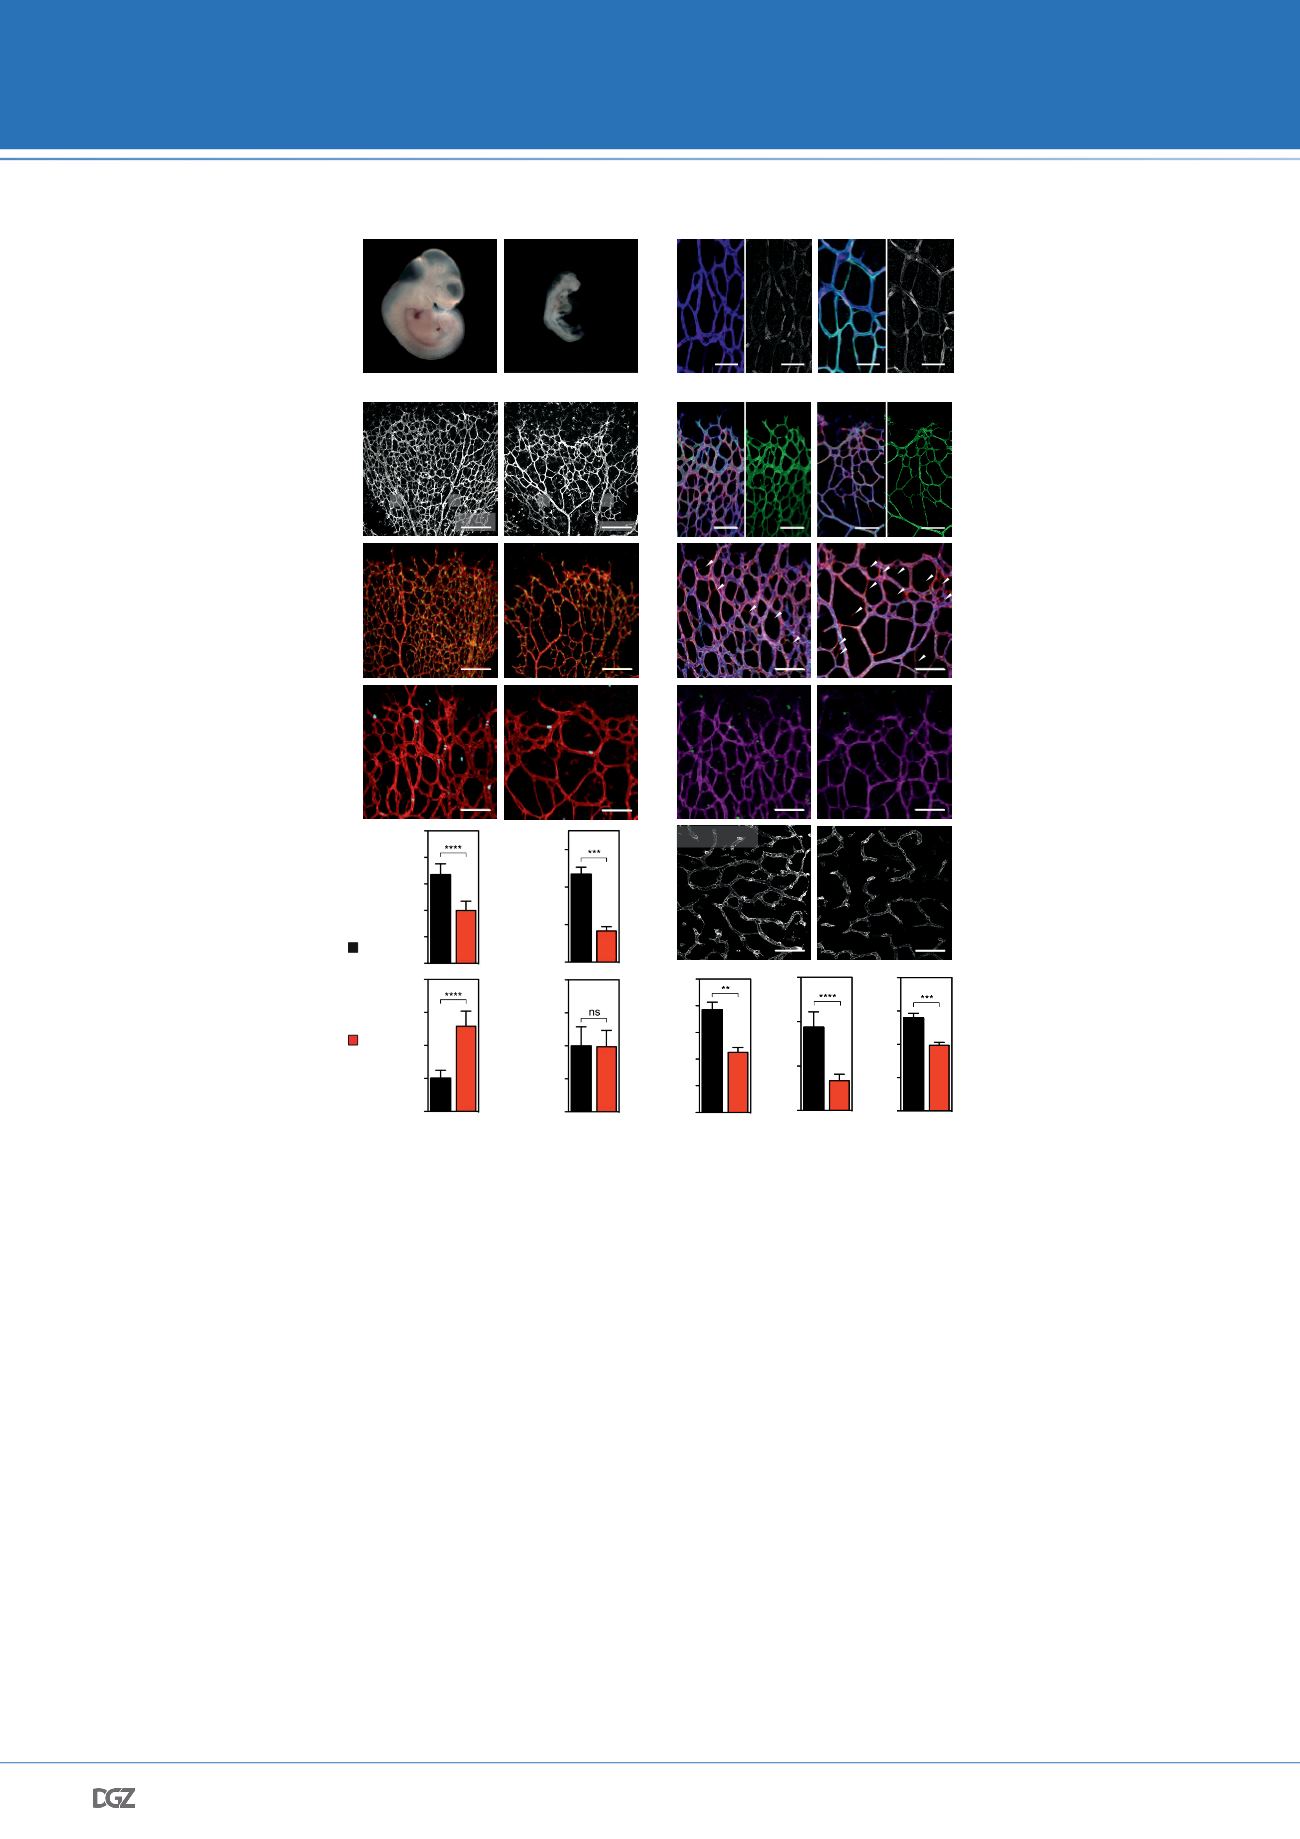
a, Overview images of freshly dissected E10.5 mouse embryos
showing severe growth retardation in the constitutive
Foxo1
EC-CA
mutants compared to control mice. b, Immunofluorescence
staining for FOXO1 (magenta), GFP (green) and PECAM (blue)
in P5
Foxo1
iEC-CA
and control mice. Note the enhanced nuclear
FOXO1 signal in the GFP
+
/PECAM
+
-vessels. The right half of
both images shows the FOXO1 staining (grey) alone. c, Confocal
images showing the IB4-stained vasculature of P5 retinas in
inducible
Foxo1
iEC-CA
and control mice. A, artery; V, vein. d, Anal-
ysis of ERG- (green) and IB4- (red) stained P5 retinas in control
and
Foxo1
iEC-CA
mice illustrates a reduced number of ECs in the
vasculature of
Foxo1
iEC-CA
mice when compared to controls. e,
IB4 (red) and pHH3 (cyan) labelling of whole-mount P5 retinas
reveals reduced endothelial proliferation in
Foxo1
iEC-CA
ani-
mals when compared to controls. f, Quantification of vascular
parameters in the control and mutant retinas as indicated (n
≥
5). Data represent mean ± s.d. Two-tailed unpaired
t
-test. g,
Whole-mount ICAM2 (green), IB4 (blue) and COL (red) staining
of retinas at P5 showing preserved luminal ICAM2 staining in
Foxo1
iEC-CA
when compared to control. The right half of both
images shows the ICAM2 staining (green) alone. h, Whole-
mount triple immunofluorescence for VECAD (green), IB4 (blue)
and COL (red) of P5 control and
Foxo1
iEC-CA
retinas. The number
of empty (COL
+
, IB4
-
-negative) sleeves (white arrows) in the
retinal plexus is increased in the
Foxo1
iEC-CA
mutants. i, Confocal
images of IB4- (magenta) and cleaved Caspase 3 (CASP3; green)
stained P5 retinas showing no difference in endothelial apopto-
sis between control and
Foxo1
iEC-CA
mutant mice. j, IB4-stained
(grey) E11.5 hindbrains following 4-OHT injection on E8.5 –
E10.5 showing reduced vascularization in the ventricular zone
of
Foxo1
iEC-CA
mice. k, Quantification of EC area, vessel branch
points and mean vessel diameter in control and
Foxo1
iEC-CA
mu-
tant hindbrains. Controls are littermate animals without cre (n
≥
5). Data represent mean ± s.d. Two-tailed unpaired
t
-test.
**P <
0.01;
***P
< 0.001;
****P
< 0.0001.
Figure 2
a
b
Control
Control
Foxo1
EC-CA
E10.5
Foxo1
iEC-CA
E10.5
pHH3
/
IB4
IB4
c
Control
Foxo1
iEC-CA
ICAM2
/
IB4
/
COL
Control
Foxo1
iEC-CA
cleav. CASP3
/
IB4
VECAD
/
IB4
/
COL
d
e
g
h
i
100
μ
m
100
μ
m
IB4
EC area per field (%)
Branch points per field
Vessel diameter (µm)
40
50
20
0
30
10
20
0
10
10
5
15
k
100
μ
m
30
0
20
j
f
Foxo1
iEC-CA
Control
40
60
80
100
20
0
ERG
+
-cells per field
cleav. CASP3
+
/ IB4
+
-
cells per field
2
0
3
1
100
μ
m
4
50
μ
m
FOXO1
/
GFP
/
PECAM
FOXO1
200
μ
m
ERG
/
IB4
A
V
A
V
0
5
10
15
pHH3
+
-ECs per field
COL
+
/ IB4
-
-sleeves
per field
20
0
30
10
40
100
μ
m
E11.5 hindbrain
V
A
V
A
200
μ
m
Figure 2 – Forced activation of FOXO1 restricts endothelial growth and vascular expansion


