Cell News 01/2017
25
WERNER RISAU PRIZE 2017
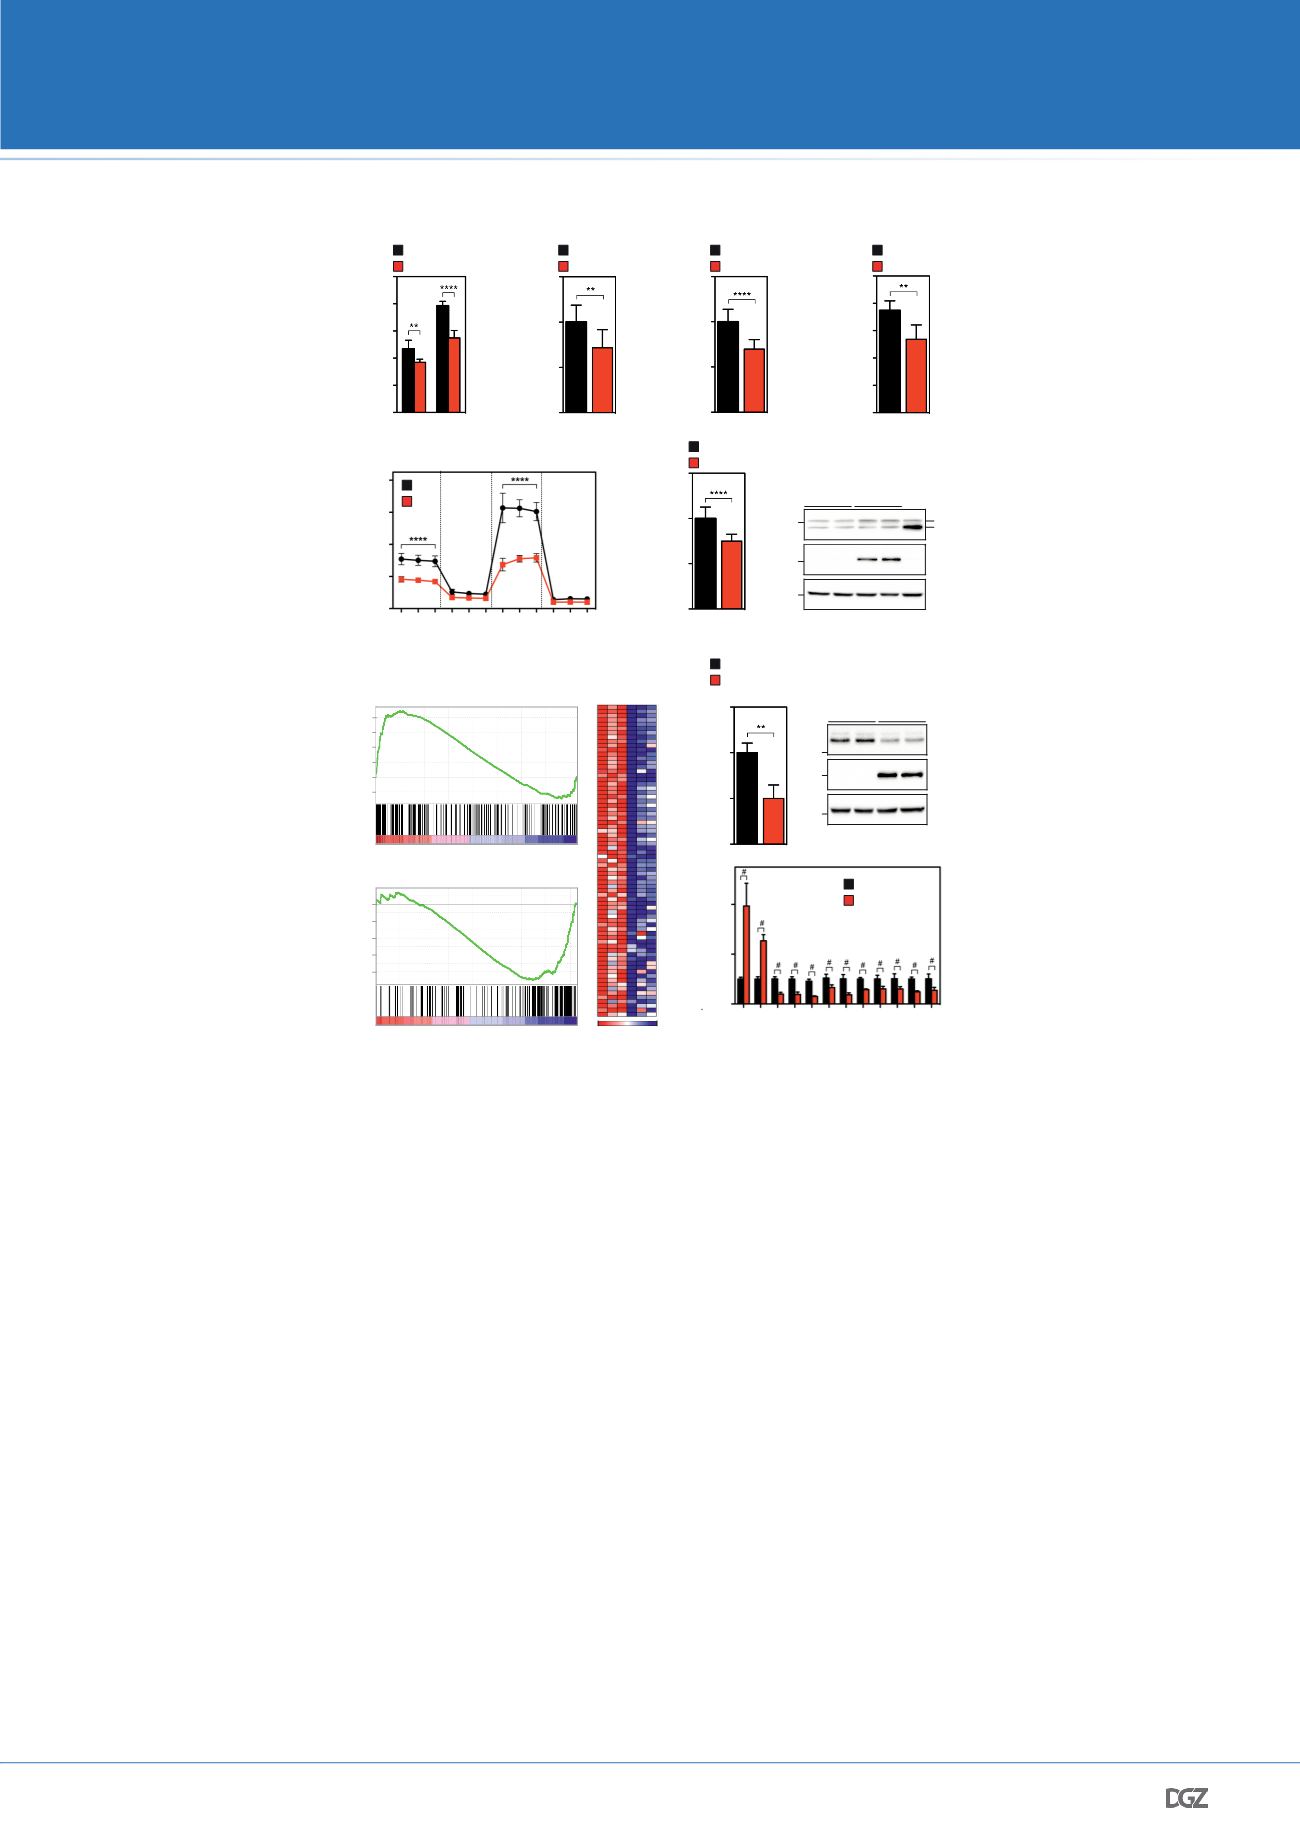
a, Extracellular acidification rate (ECAR), an indicator of
glycolytic lactate production, in ECs treated with or without
oligomycin (Oligo) showing reduced basal and maximal gly-
colytic activity in AdFOXO1
CA
-transduced ECs when compared
to control adenovirus- (AdCTL) transduced ECs (n = 6). Data
represent mean ± s.d. Two-tailed unpaired t-test. b-d, Reduced
uptake of the glucose analogue 2-deoxy-D-glucose (2-DG) (n =
13), decreased relative lactate production(n = 10) and lowered
glycolytic flux (n = 4) in control and FOXO1
CA
-expressing ECs.
Data represent mean ± s.d. Two-tailed unpaired
t-
test. e, Oxy-
gen consumption rates (OCR) in control and FOXO1
CA
-overex-
pressing ECs under basal conditions and in response to oligomy-
cin (Oligo), fluoro-carbonyl cyanide phenylhydrazone (FCCP) or
antimycin A (AA) and rotenone (R). (n = 5). Data represent mean
± s.d. Two-way ANOVA with Bonferroni’s multiple comparison
test. f, Relative ROS levels in ECs 24 hours post transduction
with AdCTL or AdFOXO1
CA
(n = 7). Data represent mean ± s.d.
Two-tailed unpaired
t
-test. g, Western blot analysis showing
that overexpression of the Flag-tagged FOXO1
CA
does not induce
autophagy in ECs as the LC3-II to LC3-I ratio was not signifi-
cantly changed. Chloroquine- (CQ) treated EC were used as a
positive control. TUB, Tubulin. Densitometric quantifications 0
are shown below the lanes (n = 10). Data represent mean ± s.d.
Two-tailed unpaired
t
-test. h, Gene set enrichment analysis of
the FOXO1- (AAACAA) or MYC- (CACGTG) DNA binding element
gene sets in AdFOXO1
CA
- or AdCTL-transduced ECs. Note that
the FOXO1 motif is enriched in the genes induced by AdFOXO-
1
CA
, while the MYC motif is enriched in the genes repressed by
FOXO1. Black bars represent individual genes in rank order. ES,
enrichment score, NES, normalized enrichment score. i, Heatmap
of downregulated MYC signature genes in FOXO1
CA
-overexpress-
ing ECs (n=3). j,k, Analysis of MYC expression by microarray (j)
and immunoblot (k) demonstrating the suppression of MYC in
FOXO1
CA
-Flag-overexpressing endothelium. The densitometric
quantification of MYC protein levels is shown below the lanes
of the immunoblot. (j, n = 6; k, n= 10). Data represent mean ±
s.d. Two-tailed unpaired
t
-test. l, Quantitative polymerase chain
reaction (qPCR) expression analysis of FOXO1
CA
-regulated genes
involved in MYC signalling. Relative mRNA levels are shown (n
≥
3). Data represent mean ± s.d. Two-tailed unpaired
t
-test.
*P
<
0.05;
**P
< 0.01;
****P
< 0.0001;
#P
< 00.1; ns, not significant.
Figure 3
a
Oligo
100
200
ECAR (mpH/min)
0
- +
250
150
50
AdFOXO1
CA
AdCTL
0
1000
2000
3000
4000
5000
Glycolysis
(nmol gluc./h/mg prot.)
AdFOXO1
CA
AdCTL
c
b
e
100
200
300
400
OCR (pmol O
2
/min)
0
20 40 60
0
Time (min)
Oligo FCCP AA / R
AdFOXO1
CA
AdCTL
TUB
M
r
(K)
15
75
FLAG
LC3-I
LC3-II
AdFOXO1
CA
AdCTL
CQ
50
d
g
AdFOXO1
CA
AdCTL
0.5
1.0
1.5
0
Lactate production
(fold change)
f
0.5
1.0
1.5
0
Relative ROS levels
(CM-DCF fluorescence)
0.5
1.0
1.5
0
Glucose (2-DG) uptake
(fold change)
AdFOXO1
CA
AdCTL
AdFOXO1
CA
AdCTL
h
0
-0.1
AdFOXO1
CA
AdCTL
0
-0.4
-0.2
-0.1
-0.3
ES -0.45
NES -1.36
p
< 0.001
MYC motif
Enriched in AdCTL
AdFOXO1
CA
AdCTL
ES 0.44
NES 1.52
p
< 0.001
FOXO1 motif
Enriched in AdFOXO1
CA
0.1
0.2
0.3
0.4
Enrichment Score
AdFOXO1
CA
AdCTL
max
min
CCNB1
TYMS
UBE2C
CAD
MTHFD1
TK1
CDC25A
MRTO4
CDK4
CKS2
RPL27A
PRPS2
DKC1
POLD2
AKAP1
MSH2
STEAP2
FXN
FASN
PA2G4
SHMT1
EXOSC8
APEX1
NUP155
PYCR1
HSPD1
CCND2
HSPA9
HNRNPA1
RPP30
EMP1
NCL
HSPE1
TP53
ElF48
GNL3
RPS6KA2
PPAT
CCT5
FOSL1
ENO1
DDX10
CEBPZ
LTA4H
PSMG1
H2AFZ
E2F1
ODC1
EIF2S1
EIF4A1
EIF48
SRM
RPL22
TRFC
NBN
PRDX3
RPL13
DDX18
EIF4E
METTL1
PHB
E2F3
HMGA1
PRKCE
SNRPB
NPM1
PTMA
RFC2
EIF4B
LDHA
TIMM10
ELAVL1
CBX3
i
Fold regulation
MYC
1.0
0
0.5
1.5
MYC
FLAG
TUB
AdFOXO1
CA
AdCTL
j
k
0
2.0
4.0
CCND1
CCND2
CCNB2
ENO1
PKM2
LDHA
LDHB
FASN
Fold regulation
MXI1
FBXW7
MYC
CDK4
l
M
r
(K)
50
75
50
AdFOXO1
CA
AdCTL
100 ± 2 44 ± 4****Ratio (%)
100 ± 2 110 ± 1
ns
Ratio (%)
AdFOXO1
CA
AdCTL
Figure 3 – FOXO1 slows endothelial metabolic activity and suppresses MYC signalling.


