Cell News 02/2017
26
WERNER RISAU PRIZE 2017
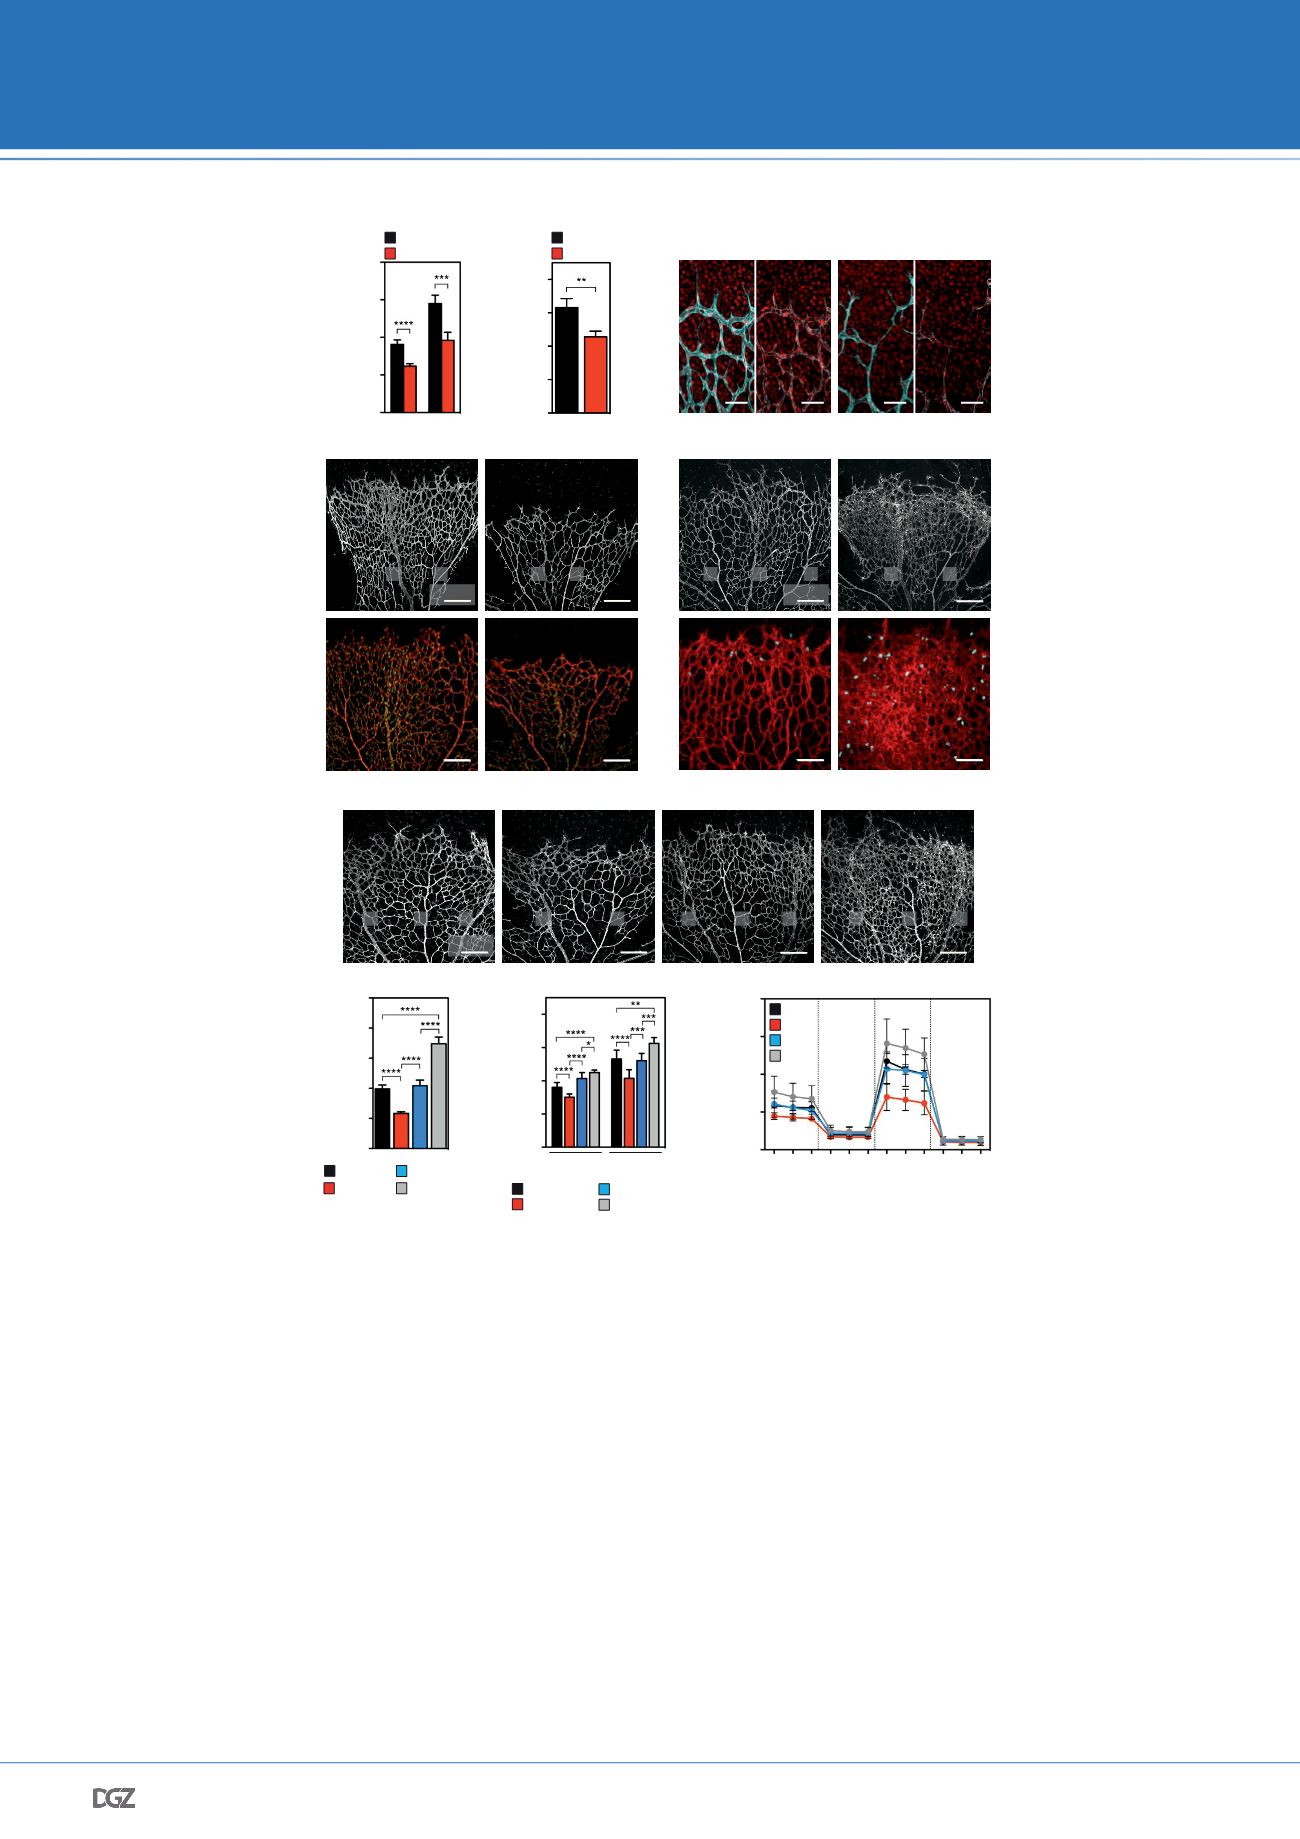
a,b, ECAR (b) and OCR (c) in HUVECs showing a reduced
metabolic activity in MYC siRNA- (siMYC) compared to SCR
siRNA- (siSCR) transfected ECs (ECAR: n = 5; OCR: n = 5). Data
represent mean ± s.d. Two-tailed unpaired
t
-test. c, Immuno-
fluorescence staining for
MYC
(red), VECAD (grey) and PECAM
(cyan) in P5 retinas of
Myc
iEC-KO
and control mice. d, Confocal
images of the IB4-stained vasculature in P5 retinas of
Myc
iEC-KO
and control mice. A, artery; V, vein. e, Confocal images of IB4
(red) and nuclear ERG (green) stained P5 retinas of control and
Myc
iEC-KO
mutant retinas showing a reduced number of ECs in
the vasculature of
Myc
iEC-KO
mice when compared to controls. f,
Overview images of IB4-stained P5 retinal vessels in
Myc
iEC-OE
and control mice. g, Enhanced EC proliferation in
Myc
iEC-OE
mice
as revealed by IB4 (red) and pHH3 (cyan) co-staining in P5 reti
nas. h,i, Confocal images of IB4-stained (grey) P5 retinas
in control,
Foxo1
iEC-CA
,
Myc
iEC-OE
and
Foxo1
iEC-CA
/
Myc
iEC-OE
dou-
ble mutants. Representative images (h) and quantification of
endothelial coverage (i) in the respective genotypes are shown.
Controls are littermate animals without cre expression (n
≥
6
from 3 independent litters). Data represent mean ± s.d. One-
way ANOVA with Bonferroni’s multiple comparison post-hoc
test. j,k, ECAR (j) and OCR (k) in AdCTL, AdFOXO1
CA
, AdFOXO1
CA
/
AdMYC and AdMYC-transduced HUVECs showing the resto-
ration of metabolic activity in FOXO1
CA
/MYC co-expressing ECs
(ECAR: n = 8; OCR: n
≥
3). Data represent mean ± s.d. One-way
ANOVA with Bonferroni’s multiple comparison post-hoc test was
performed in (j).
**P
< 0.01;
***P
< 0.001;
****P
< 0.0001.
Figure 4
a
Oligo
100
200
ECAR (mpH/min)
0
- +
150
50
siSCR
100
200
OCR (pmol O
2
/min)
0
150
50
Control
Myc
iEC-OE
c
IB4
d
Control
Myc
iEC-KO
e
pHH3
/
IB4
h
100
μ
m
iB4
Control
Foxo1
iEC-CA
Foxo1
iEC-CA
;Myc
iEC-OE
Myc
iEC-OE
100
200
300
400
OCR (pmol O
2
/min)
0
20 40 60
0
Time (min)
Oligo FCCP AA / R
AdFOXO1
CA
AdCTL
AdFOXO1
CA
/MYC
AdMYC
Oligo
100
200
ECAR (mpH/min)
0
-
+
150
50
i
j
k
ERG
/
IB4
IB4
f
g
40
100
EC area per field (%)
0
60
20
80
FOXO1
CA
/MYC
OE
Control
FOXO1
CA
MYC
200
μ
m
V
A
A
V A
A
100
μ
m
MYC
/
VECAD
/
PECAM
siMYC
siSCR
siMYC
b
AdFOXO1
CA
AdCTL
AdFOXO1
CA
/MYC
AdMYC
A V
A V
V A
A
A
V
V A
A
A
A
V
V
V
V
V
V
200
μ
m
200
μ
m
200
μ
m
Control
Myc
iEC-KO
50
μ
m
Figure 4 – MYC is a critical component of FOXO1 signalling in ECs.


