Cell News 04/2019
24
and efferent LN collecting vessels (Fig. 2, K-L). Our data cor-
roborate the lymphatic vessel-independent LN initiation model
for the iLN (Vondenhoff et al., 2009b). However, in agreement
with Onder et al., they show that a reservoir of disseminated LTi
cells critically contributes to LN expansion. These results unify
the previous models and further suggest that the SMC coverage
in part defines the site and the time of pre-LTi cell egress from
veins.
To further confirm that LTi cell uptake and transport by lym-
phatic vessels and capsule is essential for LN development, we
analyzed signaling molecules involved in LTi cell trafficking.
In adults, CCR7 drives migration of DCs and T cells towards
and inside of CCL21
+
initial lymphatics (Bromley et al., 2005;
Debes et al., 2005; Ohl et al., 2004; Russo et al., 2016). As LTi
cells express functional CCR7 (Honda et al., 2001), we analyzed
iLN development in
Ccr7
-/-
mice.
Ccr7
-/-
iLNs were smaller and
we observed almost no intralymphatic LTi cell clusters (Fig. 3,
A-D). Meanwhile, the extravascular CD4
+
LTi cell fraction was
increased (Fig. 3D). Therefore, in addition to the role of CCL21
in LTi cell retention at LN site (Onder et al., 2017), CCL21
+
initial
lymphatics attract and collect disseminated LTi cells. The dynam-
ic equilibrium between arriving, retained and departing LTi cells
thus defines the iLN size. To study whether defective retention
of LTi cells shifts the balance towards LTi cell accumulation in
lymphatic vessels, we analyzed
Cxcr5
-/-
embryos. Loss of CXCR5
+
LTi cell attraction by CXCL13
+
LTo cells prevents formation of
most peripheral LNs, including iLN (Ansel et al., 2000; Förster
et al., 1996; Ohl et al., 2003) and Fig. 3, E, E’ and F). Lymphatic
vessels at the presumptive
Cxcr5
-/-
iLN site did not develop the
characteristic lymphatic “cup” found in wildtype mice but main-
tained a collecting vessel phenotype (Fig. 3, E and E’), further
confirming the driving role of LN anlagen in LN capsule and SCS
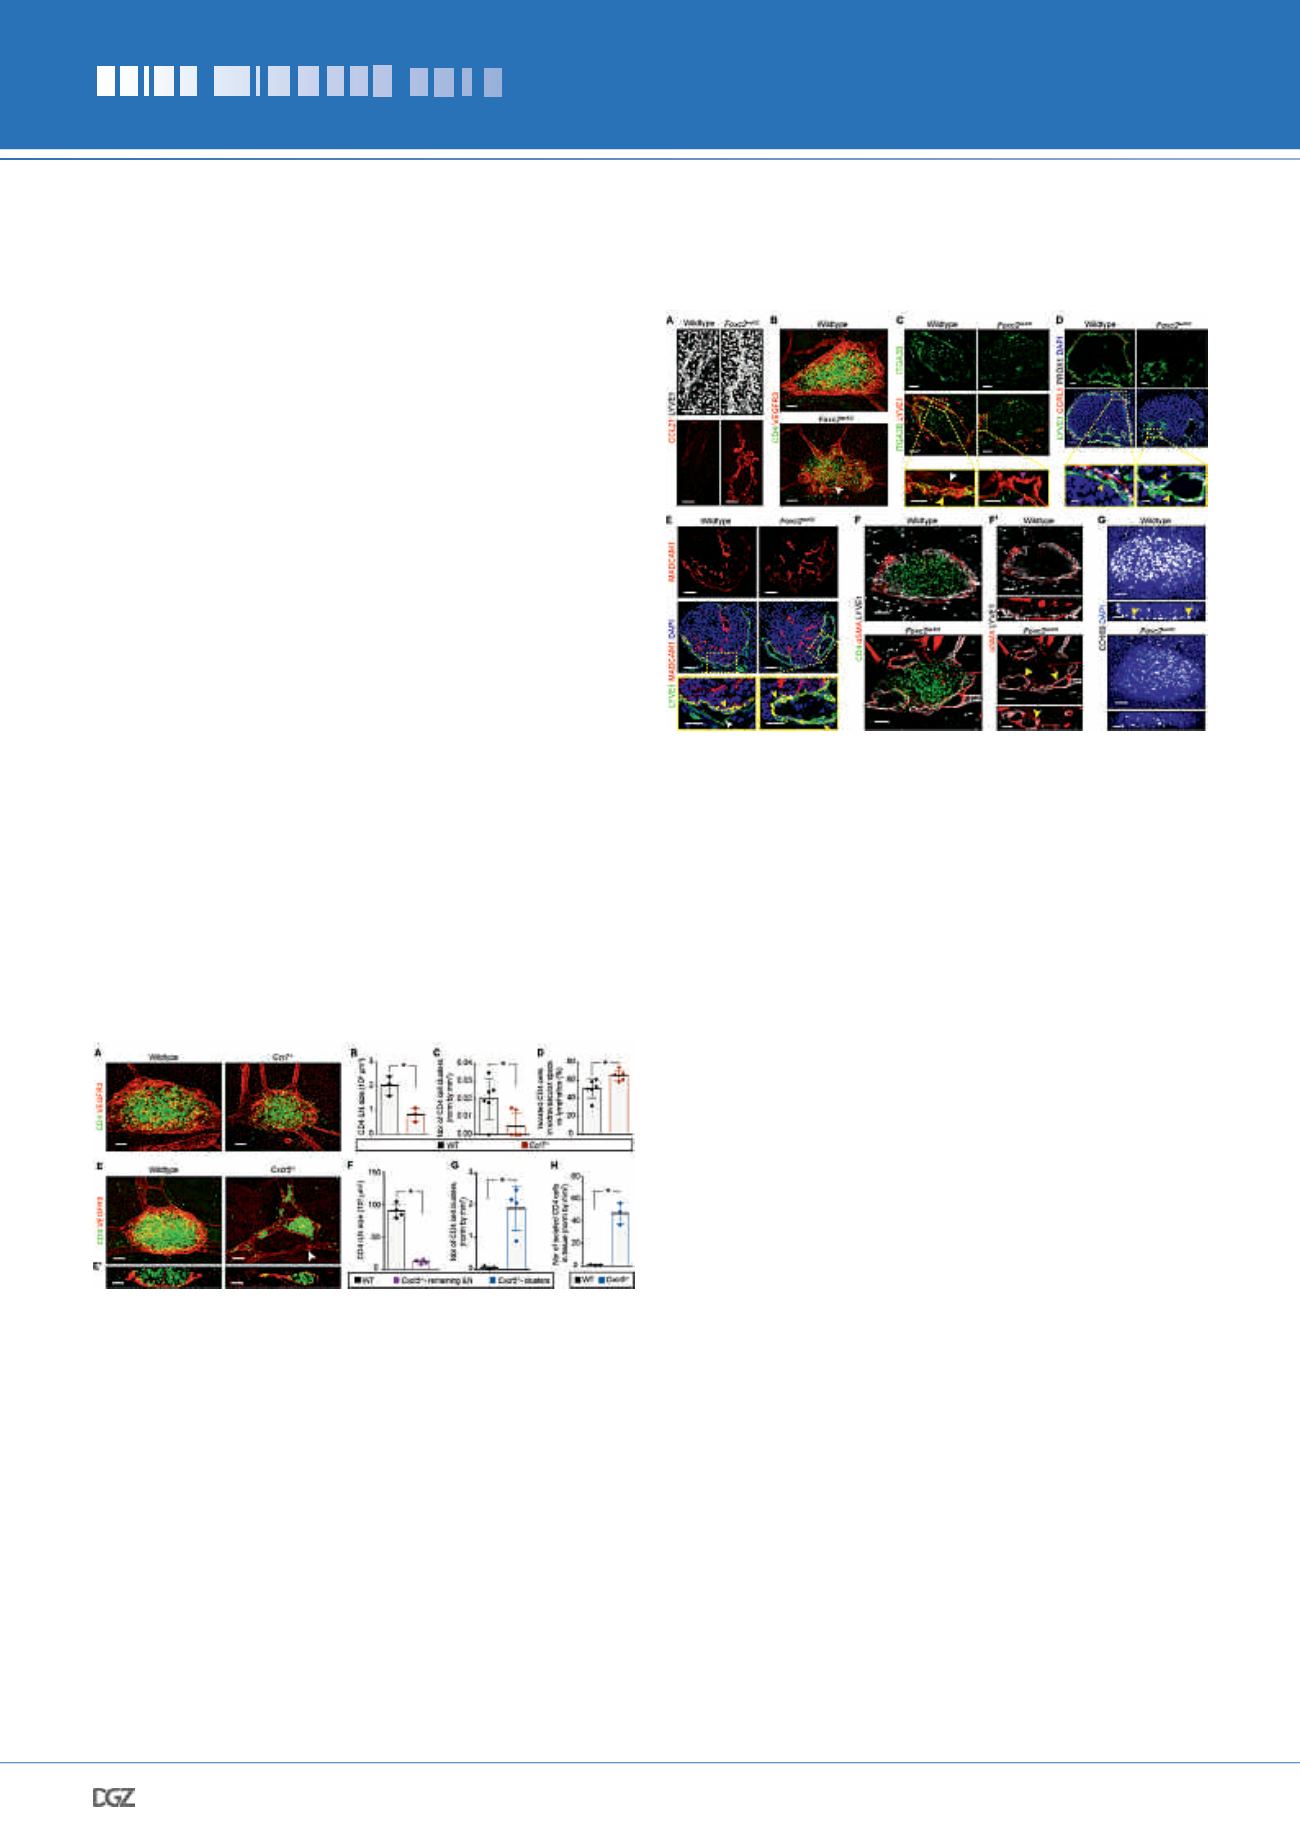
PRIZE WINNERS 2019
Figure 4. Impaired collecting vessel development disrupts
LN LEC specification and capsule formation.
(A) Increased LEC capillary markers in
Foxc2
lecKO
mice. Whole-mount
skin; CCL21 (red) and LYVE1 (white). Scale bar, 100 μm. E18.5
n
= 2
per genotype. Similar expression pattern was observed at E20.5 (WT
n
= 1;
Foxc2
lecKO
n
= 3). (B) Impaired LN capsule organization in
Fox-
c2
lecKO
embryos. Whole-mount iLN area; CD4 (green) and VEGFR3 (red).
Arrowhead, mesh-like lymphatic capsule. E19.0
n
= 3 per genotype.
Scale bar, 50 μm. (C) Loss of fLEC ITGA2B expression in
Foxc2
lecKO
mice.
Staining of E18.5 iLN for ITGA2B (green) and LYVE1 (red). Lower panels:
high-magnification images. White arrowhead, cLECs; yellow arrowhead,
fLECs; pink arrowheads,
Foxc2
lecKO
unspecified LECs. WT
n
= 3;
Foxc2
lecKO
n
= 5. Scale bars, 50 μm and 20 μm. (D) Reduced CCRL1 expression in
Foxc2
lecKO
LN. Staining of E20.5 axillary LN for LYVE1 (green), CCRL1
(red), PROX1 (white) and DAPI (blue). Lower panels: high-magnification
images. White arrowhead, LYVE1low CCRL1
high
LECs; yellow arrowheads,
LYVE1
high
CCRL1
neg
LECs. WT
n
= 4;
Foxc2
lecKO
n = 3. Scale bars, 50 μm
and 10 μm. (E) Loss of polarized MADCAM1 in iLN LECs of
Foxc2
lecKO
mice. Staining for LYVE1 (green), MADCAM1 (red) and DAPI (blue).
Lower panels: high-magnification images. White arrowhead, LYVE1
low
MADCAM1
neg
LECs; yellow arrowheads, LYVE1
high
MADCAM1
high
LECs.
E18.5-E20.5 WT
n
= 4 and
Foxc2
lecKO
n
= 3. Scale bars, 50 μm and 25
μm. (F) Mislocalized SMC coverage on
Foxc2
lecKO
iLN lymphatics. Whole-
mount iLN (10-μm); CD4 (green),
α
SMA (red) and LYVE1 (white). (F’)
Transverse (upper) and frontal (lower) views (10-μm) of
F
. Arrowheads,
ectopic SMCs. E18.5 WT
n
= 3;
Foxc2
lecKO
n
= 4. Scale bar, 50 μm.
(G) Reduced number and mislocalization of CD169
+
macrophages in
Foxc2
lecKO
mice. Whole-mount iLN; CD169 (white) and DAPI (blue).
Lower panels: 10-μm frontal views. Arrowheads, CD169
+
macrophages.
E18.5-E19.0 WT
n
= 5;
Foxc2
lecKO
n
= 4. Scale bar, 70 μm.
Figure 3. Embryonic lymphatics transport LTi cells.
(A) Smaller iLNs in
Ccr7
-/-
embryos. Whole-mount iLN; VEGFR3 (red)
and CD4 (green). E18.5
n
= 3 per genotype. Scale bar, 50 μm. (B)
Quantification of iLN size in WT and
Ccr7
-/-
embryos. E18.5
n
= 3 per
genotype; *
P
< 0.05. (C) Quantification of intralymphatic CD4
+
clusters.
E18.5
n
= 6 per genotype; *
P
< 0.05. (D) Percentage of extravascu-
lar CD4
+
cells in WT and
Ccr7
-/-
skin. E18.5
n
= 6 per genotype; *
P
<
0.05. (E) Absence of cup-like lymphatic structures in
Cxcr5
-/-
embryos.
Whole-mount iLN; VEGFR3 (red) and CD4 (green). (E’) 10-μm frontal
section. Arrowhead, lymphatic valve. E19.0
n
= 3 per genotype. Scale
bar, 50 μm. (F) CD4
+
inguinal cluster size in WT and
Cxcr5
-/-
mice. E19.0
n
= 4 per genotype; *
P
< 0.05. (G) Quantification of intralymphatic
CD4
+
clusters in WT and
Cxcr5
-/-
E19.0 skin. WT
n
= 3,
Cxcr5
-/-
n
= 4;
*
P
< 0.05. (H) Quantification of isolated CD4
+
cells in WT and
Cxcr5
-/-
E19.0 skin.
n
= 3 per genotype; *
P
< 0.05. All quantifications, 2-tailed
unpaired Student’s t test.


