Cell News 04/2019
23
PRIZE WINNERS 2019
LN induces a coordinated remodeling and expansion of adjacent
lymphatic vessels to form the LN anlage (Fig. 1E).
We then assessed if blood vessels, lymphatic vessels or both,
played a role in LN initiation. To characterize the LN initiation
process in more detail we first visualized the localization of
CD4
+
LTi cells and blood vessels at different development stages
by staining for
α
SMA, the venous marker endomucin and the
basement membrane component laminin
α
5. We observed sig-
nificantly higher SMC coverage of the subepigastric vein at the
iLN site at E16.5 in comparison to E15.0 (Fig. 2, A-C). At E15.0,
only arteries produced laminin
α
5 (Fig. 2B). We also observed a
strikingly different SMC coverage of the subepigastric vein along
the anterior-posterior axis: the vein in the axillary region had a
continuous SMC layer, but SMCs at the venous bifurcation in the
iLN area were so sparse that it was difficult to detect the vein
contour (Fig. 2, C-E). In contrast, we observed high laminin
α
5
deposition and complete venous SMC coverage in both locations
after E16.5 (Fig. 2, B and C). Importantly, at E15 we observed LTi
cell trafficking in SMC-low gaps in the venous EC layer (Fig. 2,
F and F’). These results suggested that LTi cells egress from the
vein in the immature inguinal area to induce LN initiation.
To test if reduced SMC coverage would modify LTi cell migra-
tion into the inguinal anlage, we analyzed
Pdgfb
ret/ret
embryos,
which have low perivascular Pdgfß and reduced recruitment of
mural cells to blood vessels (Lindblom et al., 2003). iLNs were
significantly bigger in
Pdgfb
ret/ret
embryos in comparison to
the controls, indicating that SMC coverage of blood vessels is
an important factor regulating LN development (Fig. 2, G-H).
These results support the notion that during LN initiation pre-
LTi cells egress at LN development sites using gaps in venous
mural coverage. Then, to test if lymphatic vessels play a role in
LN initiation, we blocked lymphangiogenesis by administering
VEGFR3-blocking antibodies. The treatment severely diminished
dermal lymphatics (Fig. 2I). However, prominent, albeit reduced
LTi cell accumulation was still observed in LN anlagen in the
absence of associated lymphatic vessels (Fig. 2I, LN volume
(10
3
μm
3
): control IgG: 319.2 ± 115.9; VEGFR3-blocking IgG
79.2 ± 25.5; p = 0.0272). Furthermore, we readily visualized LTi
cells in SMC-low gaps in the vein both in control and VEGFR3
IgG-treated embryos (Fig. 2I’). We next monitored the global
distribution of CD4
+
LTi cells in the embryonic skin. We observed
CD4
+
cells associated with the upper dermis blood vascular
plexus (Fig. 2, J and J’). Isolated CD4
+
cells and clusters were fre-
quently present at E15.5 in lymphatic capillaries and in afferent
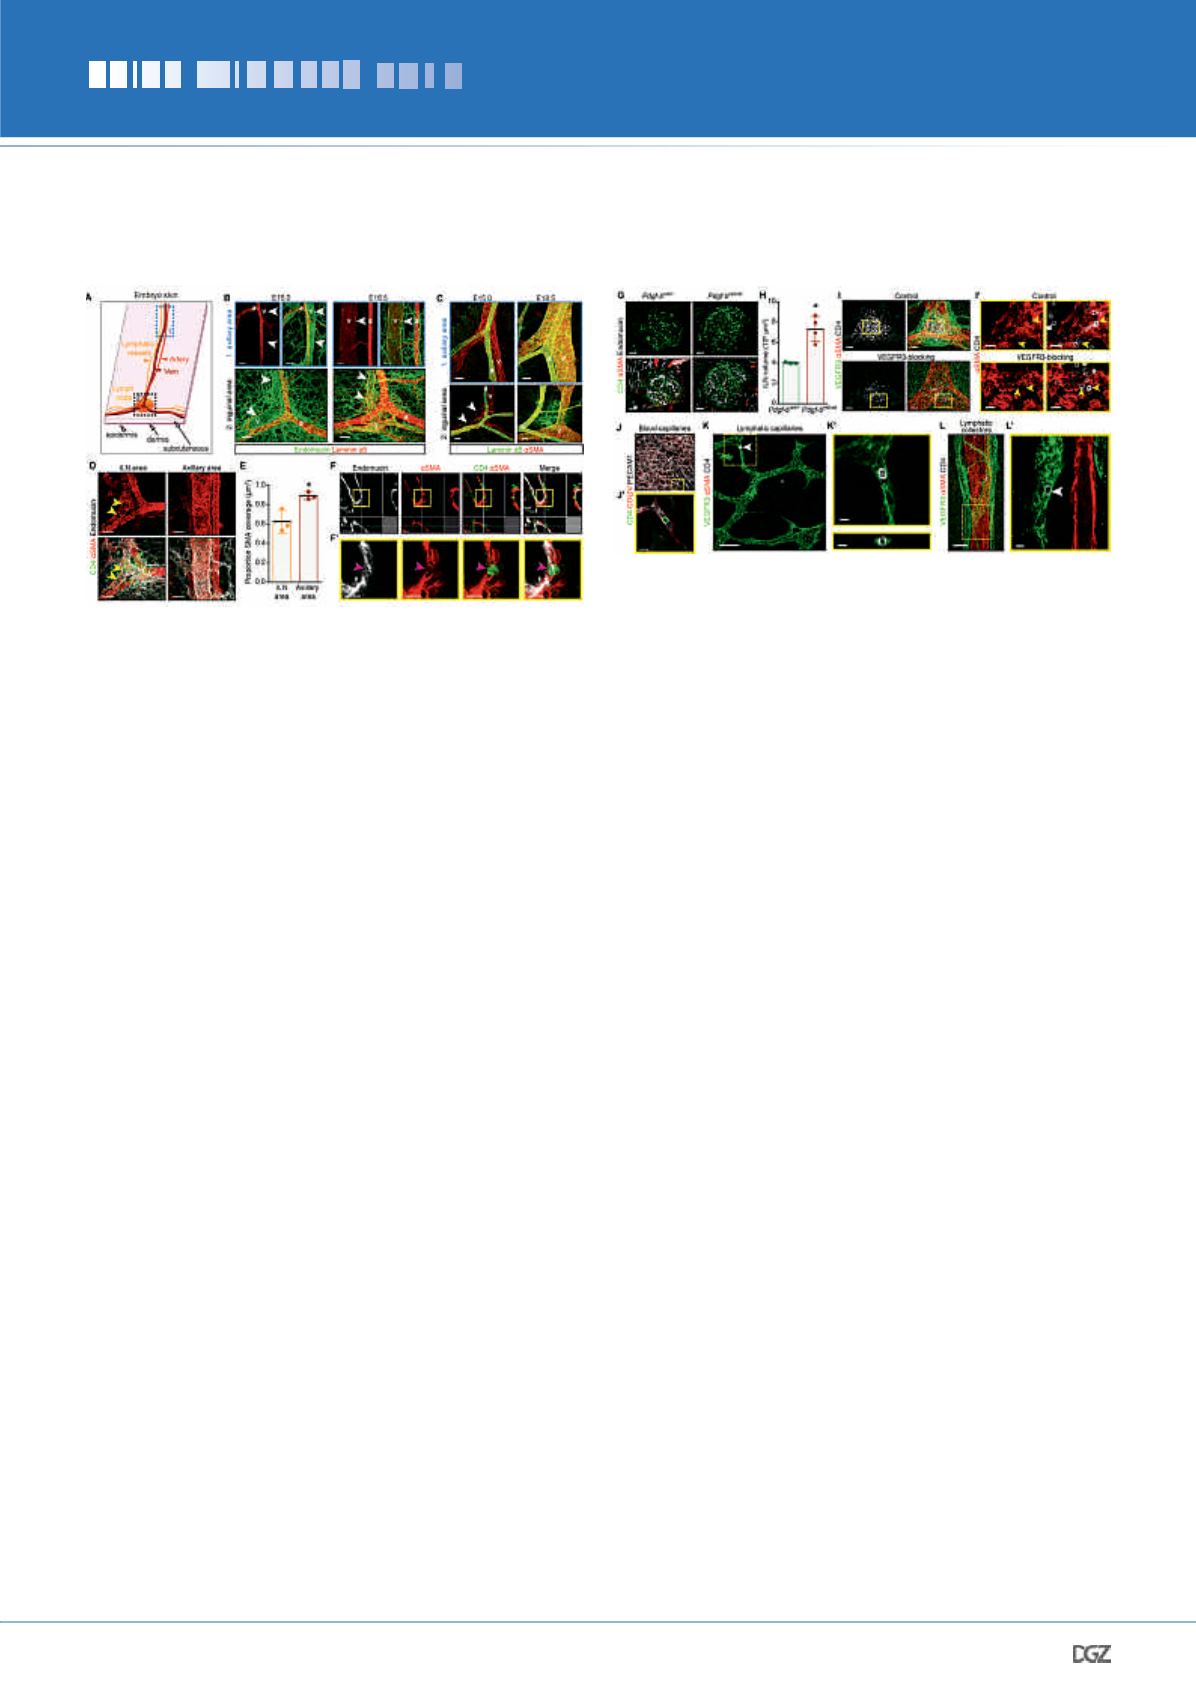
Figure 2. Blood and lymphatic vessels contribute to early
LN development.
(A) Skin areas analyzed. 1, axillary area; 2, inguinal area. (B) Lami-
nin
α
5 is not produced by veins at E15.0. Whole-mount; endomucin
(green) and laminin
α
5 (red).
v
, vein;
a
, artery; arrowheads, vein.
E15.0
n
= 4 and E16.5
n
= 3. Scale bar, 50 μm. (C) Differential venous
SMC coverage in axillary
vs
inguinal areas at E15.0 but not at E18.5.
Whole-mount;
α
SMA (red) and laminin
α
5 (green).
v
, vein;
a
, artery;
arrowheads, SMC gaps on the vein. Scale bar, 50 μm. E15.0
n
= 5 and
E18.5
n
= 3. (D) Low venous SMC coverage in E15.0 iLN region. Whole-
mount; CD4 (green),
α
SMA (red) and endomucin (white). Arrowheads,
SMC-low gaps. E15.0
n
= 3. Scale bar, 50 μm. (E) Quantification of
venous SMC coverage in iLN
vs
axillary area. E15.0
n
= 3. *
P
< 0.05. (F)
LTi cells in
α
SMA-low areas. Whole-mount of subepigastric vein (1-
μm); CD4 (green),
α
SMA (red) and endomucin (white). (F’) High-magni-
fication of
F
. Arrowhead, LTi cell in SMC-low space. E15.0
n
= 3. Scale
bars, 20 μm and 15 μm. (G) Increased LN size in
Pdgfb
ret/ret
embryos.
Whole-mount iLN (1-μm); CD4 (green), endomucin (white) and
α
SMA
(red). Scale bar, 50 μm. (H) Quantification of E17.5
Pdgfb
ret/+
and
Pdgfb
ret/ret
iLN volume.
Pdgfb
ret/+
n
= 3;
Pdgfb
ret/ret
n
= 4. *P < 0.05. (I) iLN
anlagen of embryos treated with control or VEGFR3-blocking antibody.
Whole-mount iLN; VEGFR3 (green),
α
SMA (red) and CD4 (white). E15.5
n
= 4 per treatment. Scale bar, 50 μm. (I’) High-magnification view
of
I
(1-μm). Arrowheads, LTi cells in SMC-low gaps of the vein at iLN
site. Scale bar, 20 μm. (J) LTi cells in blood capillaries. Whole-mount
skin; CD4 (green), collagen IV (red) and PECAM1 (white). E15.0
n
= 4.
Scale bar, 50 μm. (J’) High-magnification view of
J
(1-μm). Scale bar,
15 μm. (K) LTi cells in capillaries. Whole-mount skin; VEGFR3 (green),
α
SMA (red) and CD4 (white). Arrowhead, intralymphatic LTi cell. E15.5
n
= 4. Scale bar, 70 μm. (K’) High-magnification of 1-μm transverse
(upper) and frontal (lower) views of the area outlined in
K
. Scale bar,
10 μm. (L) LTi cells in collecting vessels. Whole-mount of skin; VEGFR3
(green),
α
SMA (red) and CD4 (white). E15.5
n
= 4. Scale bar, 70 μm.
(L’) High-magnification of
L
(1-μm). Arrowhead, intralymphatic LTi cell.
Scale bar, 10 μm. All quantifications, 2-tailed unpaired Student’s
t
test.


