cell news 2/2013
20
A
B
C
D
Phalloidin
WAVE
DAPI
Phalloidin
WAVE
DAPI
Phalloidin
WAVE
Phalloidin
WAVE
WT
WT
wave
wave
turally analyzed, the exact molecular function of Abi within the
WAVE complex remains still unclear (Chen et al., 2010).
The cytoskeleton of fxed Drosophila cells imaged by
structured-illumination microscopy (SIM)
A better mechanistic understanding of the cellular and deve-
lopmental functions of WASP proteins requires new microscopy
techniques which allow to visualize and compare protein lo-
calization as well as actin structures at high spatial and tem-
poral resolution in different genetic backgrounds. Among these
approaches is the structured illumination microscopy (SIM), a
wide-feld technique that doubles both lateral (100nm) and axi-
al (250nm) resolution (Gustafsson et al., 2008). Compared to the
conventional wide-feld microscopy images, SIM strikingly im-
proved the resolution of cytoskeletal structures of cells (Figure
3). Single microtubules and flamentous actin within the dense
actin network are clearly better resolved at the cell periphery
of Drosophila S2R+ cells, hemocyte-like cells originally derived
from late stage Drosophila embryos (Figure 3A, B).
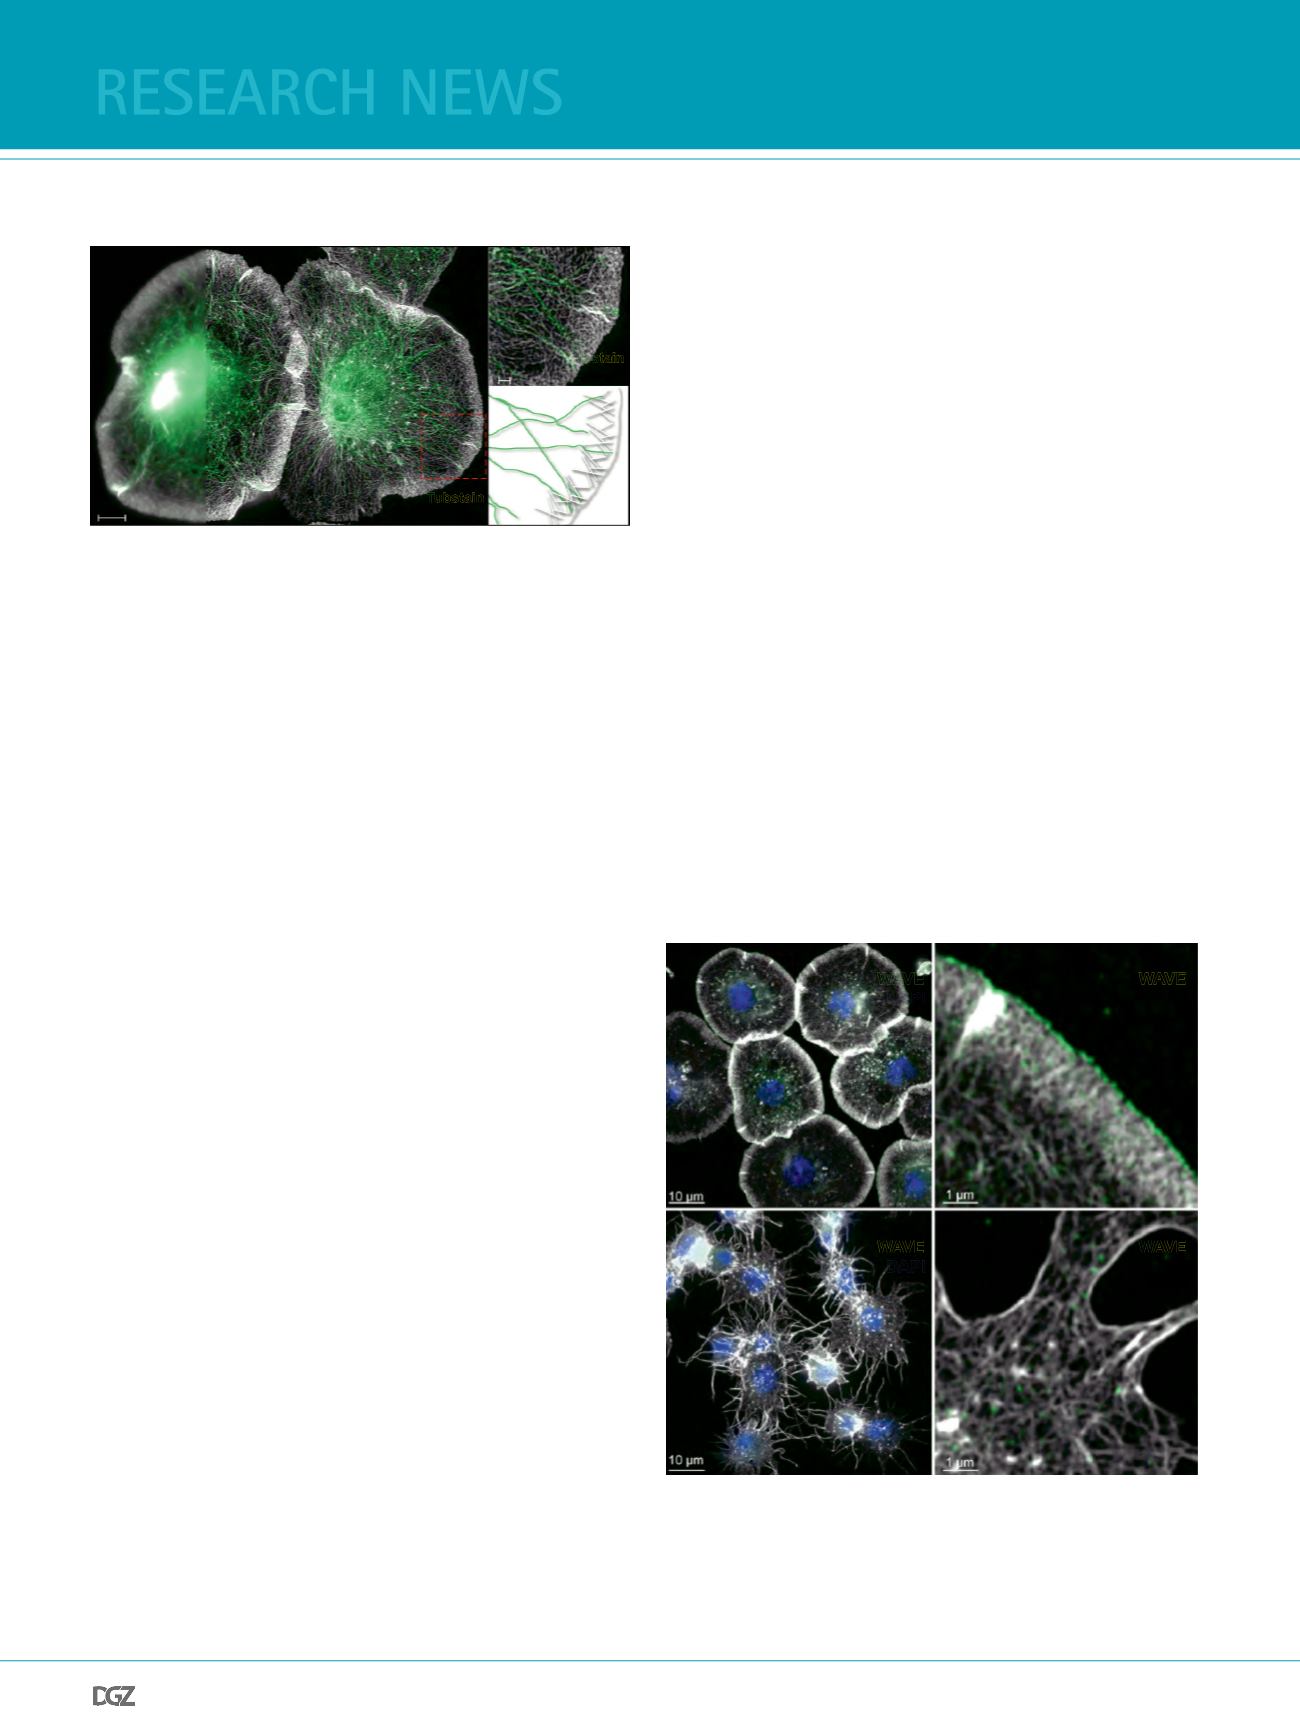
Endogenous WAVE/SCAR strongly localizes at the tip of lam-
ellipodia of S2R+ cells where it drives membrane protrusions
(Figure 4A, B; Rogers et al., 2003, Bogdan et al., 2005). Loss
of wave function causes a complete disruption of lamellipodia.
RNAi mediated knock down of Arp2/3 or WRC function result
in a characteristic starfsh-like cell morphology with multiple
flopodia-like cell extensions (Rogers et al., 2003, Kunda et al.,
2003, Bogdan & Klämbt, 2003). Recent SIM analysis of WAVE-
depleted S2R+ cells document the dramatic reorganization of
the actin cytoskeleton (Zobel and Bogdan, 2013; Figure 4C, D).
The dense actin meshwork of lamellipodia is completely disrup-
research news
A
B
C
D
Tubstain
Phalloidin
Tubstain
Phalloidin
5
µ
m
1
µ
m
ted. Knock-down cells show a loosely packed actin network and
thick actin bundles extending into the flopodia-like structures.
Visualization of higher-order actin structures in Droso-
phila at high spatial resolution
The combination of super-resolution 3D microscopy with Dro-
sophila genetics and cell biology further allows to get detailed
insights into the structural and molecular requirements of
different actin-dependent processes in vivo, in a multicellular
environment. Drosophila oogenesis provides an excellent ge-
netic model system, which requires a stereotypic set of actin-
dependent cellular processes including intercellular transport,
stable intercellular bridges, collective cell migration and cell
shape changes (Hudson & Cooley, 2002a, Bastock & St John-
ston, 2008, He et al., 2011). Drosophila ovaries contain progres-
sively maturing egg chambers. Each of them are composed of a
polarized epithelium of follicle cells surrounding 15 nurse cells
and one oocyte that are connected by F-actin rich cytoplasmic
bridges (ring canals, see Fig. 4). Recent data demonstrate that
3D SIM can have a major advantage over conventional confocal
imaging of Drosophila egg chambers (Zobel and Bogdan, 2013).
Highly patterned three-dimensional actin structures such as
ring canals or cytoplasmic bundles of actin flaments are clearly
better resolved (Figure 5). SIM analysis also revealed a more
loosely
packed actin network (average size between flamentous
Figure 3: The actin and the microtubule cytoskeleton of Drosophila
S2R+ cells.
Maximum intensity projection image of S2R+ cells stained with phalloidin-
Alexa488 (F-actin) and Tubstain-TexasRed (microtubules). (A) a part of
the entire image visualized by conventional wide-feld microscopy and
(B) imaged by structured illumination microscopy (SIM). The dense zone
of actin network at the periphery corresponds to the lamellipodium. (C)
A subset of the lamellipodium is enlarged from image B. Scale bars are
shown. (D) Schematic drawing of the branched actin network (white-grey)
at the lamellipodium tip and single microtubules (green). Images taken
from Zobel and Bogdan, 2013.
Figure 4: Disruption of the lamellipodial actin meshwork in wave
depleted S2R+ cells.
Maximum intensity projection images of wild type S2R+ cells (A, B) and
wave depleted S2R+ cells (C, D) stained with phalloidin-Alexa488 (F-actin,
white), anti-WAVE (green) and DAPI to visualize nuclei (blue). (B, D) Sub-
sets of the cell periphery are enlarged from images A and C, respectively.
Images taken from Zobel and Bogdan, 2013.


